During my 'conversations' in the comments section of the YouTube video "Denier land: How deniers view global warming" a character who fancies himself a beacon of truth challenged me with the following:
"no scientist has ever proven CO2 effects Earth's atmosphere."
Meanwhile, human-caused climate change is an observed fact.
Oh, really?
1. The Antarctic sea ice extent has increased by a record extent this year.
2. The Arctic has rebounded in recent years since the low point in 2007.
3. Polar bears are thriving.
4. Sea level is not showing acceleration and is actually dropping.
5. Cholera and Malaria are failing to follow global warming predictions.
6. Mount Kilimanjaro melt fears are being made a mockery by gains in snow cover.
7. Global temperatures have been holding steady for a decade or more.
8. Deaths due to extreme weather are radically declining.
9. Global tropical cyclone activity is near historic low
10. The frequency of major U.S. hurricanes has declined.
11. The oceans are missing their predicted heat content.
12. Big tornados have dramatically declined since the 1970s.
13. Droughts are not historically unusual.
Soooo, what human-caused climate change are you referring to, exactly?"It's a typical selection of denialists claims, and in fact, Google Searches come up with pages worth of cloned articles on each of these sound-bites - the trail points towards Anthony Watts and Marc Morano and pals being the original authors, and now, with their followers they sure have figured out how to wallpaper the internet.
~ ~ ~ ~ ~ ~ ~ ~ ~ ~ ~ ~ ~ ~ ~ ~ ~
"no scientist has ever proven CO2 effects Earth's atmosphere."
The Discovery of Global Warming
~ ~ ~
Atmospheric Radiation and the “Greenhouse” Effect
~ ~ ~ ~ ~ ~ ~
1. The Antarctic sea ice extent has increased by a record extent this year.
... not to be confused with Antarctic ice shelves! (2)
For another Arctic Ice loss is about four times as great. (3)
~ ~ ~
(1) National Snow and Ice Data Center - Arctic vs. Antarctic Sea Ice
~ ~ ~
also see
Antarctica is a continent with 98% of the land covered by ice, and is surrounded by ocean that has much of its surface covered by seasonal sea ice. Reporting on Antarctic ice often fails to recognise the fundamental difference between sea ice and land ice.
Antarctic land ice is the ice which has accumulated over thousands of years on the Antarctica landmass through snowfall. This land ice therefore is actually stored ocean water that once evaporated and then fell as precipitation on the land.
Antarctic sea ice is entirely different as it is ice which forms in salt water during the winter and almost entirely melts again in the summer.
Importantly, when land ice melts and flows into the oceans global sea levels rise on average; when sea ice melts sea levels do not change measurably but other parts of the climate system are affected, like increased absorption of solar energy by the darker oceans.
To summarize the situation with Antarctic ice trends:
- Antarctic land ice is decreasing at an accelerating rate
- Antarctic sea ice is increasing despite the warming Southern Ocean
~ ~ ~
(2) Warm Ocean Causing Most Antarctic Ice Shelf Mass Loss
~ ~ ~
"... Despite the fact that the southern ice pack is larger overall than the northern, its increases are much smaller than the decreases noted for the northern hemisphere, 1.96 million km^2 in extent and 1.92 million km^2 of area. This puts the lie to claims (oft repeated) that southern gain even “almost” balances northern loss — the northern extent loss is 3.4 times as great as the southern extent gain while northern area loss is 3.8 times as great as southern area gain. When one is nearly 4 times as big as another, they are certainly not “balanced” and anyone who claims so is either a fool or an outright liar. ..."
~ ~ ~
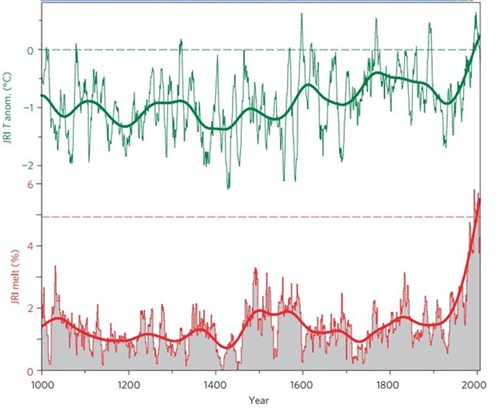
"Changes in temperature on the Antarctic Peninsula over the past 1,000 years in green and surface ice melt as a percentage of total snow fall in red. Source: Abram et al., ( 2013)"
~ ~ ~
(5) Ice Sheet Loss at Both Poles Increasing, Study Finds
~ ~ ~ ~ ~ ~ ~
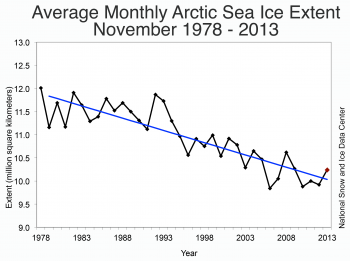
2. The Arctic has rebounded in recent years since the low point in 2007.
This is an example of ignoring the difference between a trend and short term weather.
Here take a look at what satellites have been watching:
Loss of Muli-year Arctic Sea Ice, 1987 - Present
~ ~ ~
~ ~ ~ ~ ~ ~ ~
3. Polar bears are thriving.
More cherry picking. Here we have a claim, based on one population being misrepresented as the entire Polar Bear population. It also ignores all the details as to why that group is thriving, and the prospects for their good luck continuing.
~ ~ ~
"First of all, a few points need to be made about polar bear numbers:
- Nobody really knows how many bears there were in the 1950s and 1960s. Estimates then were based on anecdotal evidence provided by hunters or explorers and not by scientific surveys.
- Polar bears are affected by several factors, including hunting, pollution and oil extraction. Most notably, hunting, particularly following the introduction of snowmobiles, airplanes and ice breakers, led to a huge decline in certain subpopulations. The introduction of the International Agreement on the Conservation of Polar Bears in 1973, which restricted or even banned hunting in some circumstances, consequently resulted in an increase in polar bear numbers.
With this caveat in mind, what do the figures actually say? According to a 2009 report by the IUCN Polar Bear Specialist Group, of the 19 recognised subpopulations of polar bears, 8 are in decline, 1 is increasing, 3 are stable and 7 don’t have enough data to draw any conclusions. Figure 1 below compares the data for 2005 and 2009."
- Not all subpopulations are affected to the same degree by climate change, and while some subpopulations are well studied, for others there is insufficient data to make broad statements about current and past numbers.
~ ~ ~
Here is a more balanced and educational look at the study denialists have been misrepresenting.
September 11, 2013 | Fairbanks Daily News - Miner
~ ~ ~
For more information check out these informative articles:
~ ~ ~ ~ ~ ~ ~
4. Sea level is not showing acceleration and is actually dropping.
Interesting claim, but it's meaningless to those that don't understand global ocean levels and the various dynamic impacting perceived sea-level rise. Sad part is the evidence for oceans rising is overwhelming, and a short term decline in some corner of the ocean doesn't say a thing about the entire ocean.
Turns out there are some amazing dynamics impacting regional area's of oceans. I include a lecture where Dr. Jerry X. Mitrovica does a great job of explaining it.
~ ~ ~
In Search of Lost Time:
Ancient Eclipses, Roman Fish Tanks and the Enigma of Global Sea Level Rise
~ ~ ~
Here's an interesting map that brings home the point of regionally variable sea level trends:
~ ~ ~
"... Things today are more certain. In its latest report, released on September 27, the IPCC finally could and did put a number on ice flow from the poles. The result was an estimate of sea level rise of 28 to 98 centimeters (a maximum of more than three feet) by 2100 — more than 50 percent higher than the 2007 projections. ..."
~ ~ ~
Zeroing In on IPCC’s Sea Level Rise & Warming ‘Hiatus’
~ ~ ~ ~ ~ ~ ~
5. Cholera and Malaria are failing to follow global warming predictions.
Here again someone like Marc SwiftBoat Trickster Morano writes: "Cholera and Malaria are failing to follow global warming predictions" links back to himself and the argument is settled to his satisfaction. No need for a pesky review of what scientists actually projected.
It's one of denialists favorite tactics, after defamation and scandal fabrication, is to misrepresent what scientists have actually claimed. If you want to learn about that, you'll have to turn away from Marc and look at some science rather that a political lobbyist.
~ ~ ~
Here is what the IPCC said in 2007,
The Regional Impacts of Climate Change
11.3.7.2. Dengue and Schistosomiasis
~ ~ ~
P.R. Hunter
School of Medicine, Health Policy and Practice, University of East Anglia, Norwich, UK
~ ~ ~
Barclay, E. (January 9, 2008). Climate change fueling malaria in Kenya, experts say. Retrieved from http://news.nationalgeographic.com/news/2008/01/080109-malaria-warming.html
~ ~ ~ ~ ~ ~ ~
6. Mount Kilimanjaro melt fears are being made a mockery by gains in snow cover.
Again a claim and no supporting evidence to be found, except that once again Google search reveals pages worth of cloned denialists parroting the claim, with no one asking for any actual evidence. Thus when someone says that scientist claimed the glacier would be gone by 2015 - they buy it and all the slander that comes along with it.
In the real world where scientists claims must withstand critical peer review both before and after publication one can find plenty of evidence that this claim is another hoax.
~ ~ ~
Glacier loss on Kilimanjaro continues unabated
"... The areal extent of Kilimanjaro's ice cover has decreased ≈85% from 12.06 km2 in 1912 to 1.85 km2 in 2007. Linear extrapolation of ice extent to the time axis [1912 to 2007, R2 = 0.98; Fig. 2 Inset] suggests that the glaciers will disappear from the summit of Kibo in 2022. In view of the likely (but unknown) errors in the determinations of the ice area at each epoch, a straight-line fit to all available values seems justified.
However, an argument can be made for a “better” fit to the data by fitting two straight lines to account for the apparent change in rate of area decrease beginning in 1976. Slightly better correlation coefficients are obtained (R2 = 0.998 for 1912 to 1976 and 0.994 for 1976 to 2007) and the predicted disappearance of the ice occurs in 2033. In either case there is a strong likelihood that the ice fields will disappear within a decade or two if current conditions persist. ..."
~ ~ ~
by Becky Oskin, LiveScience, Dec 13, 2013
"Kilimanjaro's shrinking northern glaciers, thought to be 10,000 years old, could disappear by 2030, researchers said here yesterday (Dec. 12) at the annual meeting of the American Geophysical Union.
The entire northern ice field, which holds most of Kilimanjaro\'s remaining glacial ice, lost more than 140 million cubic feet (4 million cubic meters) of ice in the past 13 years, said Pascal Sirguey, a research scientist at the University of Otago in New Zealand. That\'s a cube measuring roughly 520 feet (158 m) on each side.
The loss in volume is approximately 29 percent since 2000, while the total surface area lost is 32 percent, Sirguey said. Last year, the ice field split in two, revealing ancient lava that may not have seen the sun for millennia. [Video: Kilimanjaro's Shrinking Glaciers "
~ ~ ~

~ ~ ~ ~ ~ ~ ~
7. Global temperatures have been holding steady for a decade or more.
This is pure and simply a lie, period.
One incomplete surface temperature data set (such as the METOffice) is at best a highly educated estimate, given the data at hand, and limited to the sample area!
It does not equal the "global temperature!"
It has value for year to year comparison,
but it is not the "global temperature."
but it is not the "global temperature."
~ ~ ~
Zeroing In on IPCC’s Sea Level Rise & Warming ‘Hiatus’
Published: September 27th, 2013
~ ~ ~
Global Warming has Not Stopped
December 23, 2013
~~~
Global warming is unpaused and stuck on fast forward, new research shows
Posted on 10 December 2013 by dana1981
~ ~ ~ ~ ~ ~ ~
8. Deaths due to extreme weather are radically declining.
There are many reasons why early 20th century disasters took more lives than modern disasters. But, we're living in an era when extreme weather trend are guaranteed to get worse, so there is no reason to hope that todays and yesterdays track record will hold strong in the energized climate we have created.
This claim is based on cherry-picking the "EM-DAT’s International Disaster Database" - the document is worth a look. While you're there, check out the other data they've collected: http://www.emdat.be/disaster-trends
This claim is based on cherry-picking the "EM-DAT’s International Disaster Database" - the document is worth a look. While you're there, check out the other data they've collected: http://www.emdat.be/disaster-trends
What about the living? Take a look at http://imgur.com/a/KdyTV#6 "Number of natural disasters reported 1900-2012" reveals a frighten trend of increasing natural disasters.
Then there is this one: http://imgur.com/a/KdyTV#9 "Number of people reported affected by natural disasters 1900-2012" This graph reveals a much clearer image of what's happening out there.
Another eye opener: http://imgur.com/a/KdyTV#4 "Estimated damage caused by reported natural disasters 1975-2012"
~ ~ ~
Climate Change ‘Footprint’ Cited in Disaster Loss Trends
~ ~ ~
The Canadian Globe and Mail | Thursday, Nov. 28 2013
~ ~ ~ ~ ~ ~ ~
9. Global tropical cyclone activity is near historic lows.
As with all other things weather related there are short term up and down trends.
Besides, it is not totally clear that the statement is even marginally true since it depends on the way storms are rated and different researchers have come up with different interpretations.
It's a complex issue that can't be understood by an over simplified sound-bite. We can't grasp this stuff while ignoring all difficult aspects of this question.
It's a complex issue that can't be understood by an over simplified sound-bite. We can't grasp this stuff while ignoring all difficult aspects of this question.
This little collection relates to the Atlantic, climate dynamic remain the same even if manifested slightly differently in the different ocean basins around the world. Besides, for the interested further information is a few "searches" away.
~ ~ ~
An Overview of Current Research Results
1. Has Global Warming Affected Atlantic Hurricane Activity?
Thomas R. Knutson
Geophysical Fluid Dynamics Laboratory/NOAA
Sept. 3, 2008; Last Revised January 30, 2013
Geophysical Fluid Dynamics Laboratory/NOAA
Sept. 3, 2008; Last Revised January 30, 2013
~ ~ ~ ~ ~ ~ ~
10. The frequency of major U.S. hurricanes has declined.
The decline is within short term variability and nothing to take much comfort in.
Particularly considering what Hurricane Sandy, that hybrid super-storm of 2012, was a mere Category One hurricane.
A little extra heat, a little extra moisture, add in some sea level rise, and look what can happen.
A little extra heat, a little extra moisture, add in some sea level rise, and look what can happen.
In fact, Hurricane Sandy is an example of the sort of freak convergence of various weather systems that a warming energized global heat distribution engine will make easier to happen.
What comfort is there in a having a few 4, 5, year breaks, if you know another monster will be coming?
Even more important: How can we seriously prepare when so many demand to remain ignorant of these down to earth facts?
Even more important: How can we seriously prepare when so many demand to remain ignorant of these down to earth facts?
~ ~ ~
How Global Warming Made Hurricane Sandy Worse
By Andrew Freedman | November 1st, 2012
The Most Detailed Visuals of Hurricane Sandy, Revealed
By Andrew Freedman | October 3rd, 2013
~ ~ ~
NOAA Earth System Research Laboratory
Executive Summary (See sections below for references and citations)
~ ~ ~ ~ ~ ~ ~
11. The oceans are missing their predicted heat content.
An outdated wish-based claim that does not stand up to the continuing advancement of the complex art of probing our ocean's temperature and data gathering devices and processing ability.
Please notice in the following how the scientist takes pains to be clear that there is room for improvement and their are potentials for error that need to continue being explored.
There is nothing deceptive or "alarmist" in his report - these people are dedicated to getting everything right. And it never totally happens, but they get damn close and they pay attention to their mistakes (as opposed to hiding from them) and they learn from their mistakes always getting yet sharper.
Who's kidding who?! Scientists and technicians don't have the time to play with the numbers, and if they did, it would be obvious to the first critical observer.
In real science, it's about getting all the technical stuff right.
~ ~ ~
Ocean Cooling Corrected, Again
by Rob Painting | 28 July 2011
"The ongoing difficulty of accurately measuring the Earth's ocean heat content has led to premature "skeptic" claims about ocean cooling. A recent paper Von Schuckmann & Le Traon (2011) put the kibosh on ocean cooling claims. They find that from 2005 to 2010 the global oceans (10 to 1500 metres down) have continued to warm, although they caution that their result is based on the assumption that there are no more systematic errors in the data gathered from ARGO floats which measure ocean heat. ..."
~ ~ ~
NOAA 2012 State of the Climate: Ocean Heat Content
~ ~ ~
In Hot Water: Ocean Heat Content Continues To Soar
Joe Romm | July 23, 2013
~ ~ ~
NOAA / NODC -
Global Ocean Heat and Salt Content
~ ~ ~ ~ ~ ~ ~
12. Big tornados have dramatically declined since the 1970s.
This is a wishful thinking claim.
The scientific current consensus, that is understanding, is that there are too many variables in observations past and present to make a firm call one way or the other.
The scientific current consensus, that is understanding, is that there are too many variables in observations past and present to make a firm call one way or the other.
~ ~ ~
Tornadoes and climate change - what does the science say?
Freya Roberts | 22 May 2013
~ ~ ~
And let's not forget that it doesn't take a tornado to do tremendous damage.
ABOUT DERECHOS
Part of the NOAA-NWS-NCEP Storm Prediction Center web site
Prepared by Robert H. Johns, Jeffry S. Evans, and Stephen F. Corfidi
Prepared by Robert H. Johns, Jeffry S. Evans, and Stephen F. Corfidi
~ ~ ~
Global Warming Is Likely to Increase Severe Thunderstorm Conditions in U.S.,
Noah S. Diffenbaugh, Martin Scherer, and Robert J. Trapp.
Robust increases in severe thunderstorm environments in response to greenhouse forcing.
PNAS | Sep. 23, 2013
Robust increases in severe thunderstorm environments in response to greenhouse forcing.
PNAS | Sep. 23, 2013
~ ~ ~ ~ ~ ~ ~
13. Droughts are not historically unusual.
And droughts have historically had the ability to destroy civilizations.
Here in the US Southwest, where mega-cities have carpeted the desert, all dependent on shrinking amounts of Colorado River Water. What will they do during extended droughts when low river levels force power plants to cut back and when spigots start running dry?
The silly souls who challenged me with this list has no conception of the myriad interdependences our complex society is utterly dependent on. Nor does he/they seem to have the imagination to care.
Like the sad song says, don't know what you got till it's gone.
~ ~ ~ ~ ~ ~ ~
Soooo, what human-caused climate change are you referring to, exactly?
One can find a summation of the human-caused climate change we are living through at these links:
~ ~ ~ ~ ~ ~ ~
Science is about doing the best you can, learning all you can, sorting the kernel out of the chaff and next time getting that much better at gathering the information needed. No one ever said it was perfect - yet denialist, such as the character who cobbled together this misleading list, erect impossible expectations, then call victory if his uneducated expectations aren't met.
That's plain crazy, nor in the least bit realistic.
And when this beacon of truth is presented with rational arguments supported by solid information such as that offered in the above, they shout it down with name calling rather than evaluation of the evidence.
What happened to presenting information and staying focused on learning what we can from all the evidence we can gather?
What happened to presenting information and staying focused on learning what we can from all the evidence we can gather?
When all else fails these tricksters resort to maligning
"Scientific Consensus" as though it were an original sin.
The levels of crazy making boggle. In closing, some educated thoughts regarding the scientific consensus.
"Scientific Consensus" as though it were an original sin.
The levels of crazy making boggle. In closing, some educated thoughts regarding the scientific consensus.
The 'Consensus' View: Kevin Trenberth's Take On Climate Change
August 23, 2013
~ ~ ~ ~ ~ ~ ~ ~ ~ ~ ~ ~ ~ ~ ~ ~ ~
For responses to every imaginable Climate Science Skeptics talking point visit the excellent compilation over at SkepticalScience.com:
Global Warming & Climate Change Myths
Here is a summary of global warming and climate change myths, sorted by recent popularity vs what science says. Click the response for a more detailed response. You can also view them sorted by taxonomy, by popularity, in a print-friendly version, withshort URLs or with fixed numbers you can use for permanent references.
1 comment:
Dear Anonymous at 1:45 AM - 1/13/14
It's a shame you take offense at someone calling out the liars who are misleading our nation into it's greatest mistake yet.
But, considering the ease with which you toss around "Nazi" I don't suspect there's any hope in having a serious discussion with you.
Your comment tossed into the trash bin.
I welcome, in fact I invite, serious critique, comments, complaints - but I will not put up with empty headed ranting. Way too much of that out here already!
Post a Comment