This post was inspired by one of the comments at the WUNC debate.
Dude to CC:
“You have written perhaps the stupidest justification for producing agitprop garbage and calling it science that I have seen so far.
It would not be fair to ask you how they derive their millimeter precision from measurements that are at best accurate to a centimeter.”
____________________________________
CC responded:
Why the attitude?
There's nothing wrong with asking the question, or others.
My question is have you ever tried to find the answers to those questions?
Simply because you don't understand something doesn't mean others don’t.
After all, that’s why we have experts who have dedicated their careers and lives to their particular field of expertise. Our society would be impossible without it don't you know.
Let me start with honest curiosity and a constructive question: How do “they” derive millimeter sea level precision from measurements that are at best accurate to a centimeter?
Here's a place to start your learning. (And no it's not a simple answer that can fit on a line or two.)
"As one of its activities, the Global Geodetic Observing System (GGOS) [47] facilitates dialogue between the geodetic services with the goal of improving the reference frame. The accuracy requirements for sea-level measurements are one of the main scientific drivers for these improvements. Because we want to understand sea-level change at the 1 mm per year level, being able to measure to the 0.1 mm per year level would be ideal [2].
How well we achieve this goal depends upon the type of observation, the variability of the time series and the temporal and spatial averaging. For example, instantaneous measurements from tide gauges or altimetry are only accurate to the centimetre level at best, but averaging can allow us to obtain better estimates. In the following, we indicate where possible the levels of uncertainties in the measurements.
In each of the sections following, we discuss the different observation systems, and their contributions to understanding sea-level change. …"
____________________________________
Dude’s question reawakened my interest because I have wondered about it myself over the years without tracking it down. Now I started looking, but internet searches didn’t really get me to what I was looking for so I decided to write some emails.
I received a couple responses that did get to the heart of this question and in the process makes an excellent example of how accessible our scientists are, if you ask.
This information and evidence is rational and accessible.
If you don’t understand something look for the answer.
Don’t assume there’s no answer.
Assume you haven’t learned the answer yet.
Then fix that!
In any event, first the note I sent out, followed by responses from a couple authorities on the subject.
Hello,
I do a bit of blogging and debating with climate science contrarians, recently with one Dave (NC-20) Burton. In the course of that debate the following question, challenge, was made:
"It would not be fair to ask you how they derive their millimeter precision from measurements that are at best accurate to a centimeter."
I'm a bit of a consensus guy and though I know a bunch (for a lay person that is) about sea level rise, that particular question does stump me and I've wondered about it myself. Even googled the question, with no satisfaction.
Whereas my 'friend' thinks its some show stopper proving, scientists don't know nut’ing
- I myself figure there are some very good reasons that I simply haven't taken the time to learn about yet.
I'm hoping you might be able to give me the nickel tour of the reasons that Sea Level Rise statistics can go down to millimeter accuracy.
Best Wishes,
____________________________________
Peter,
The sensor systems that we employ, and the analysis processes we use provide a +/- 5 millimeter for monthly water level analysis (i.e. monthly Mean Sea Level heights). The Sensor Specification and Measurements Algorithms, published on our website provide some details.
We cannot actually measure the amount of sea level rise from one year to the next. That is, you cannot measure a "mean sea level" this year, and then next year and take the difference as the "sea level rise" for that two year period. Sea levels are much to variable, and subject to a large number of natural phenomena which increase of decrease the levels.
Sea Level Rise is a statistical analysis of monthly Mean Sea Level heights to provide a trend analysis; i.e. the average rate of change. We use a period of 30+ years of data to allow for the high variability in the measurements; to allow those calculations to produce results in sub-millimeter level of precision; and to provide for a small "statistical range of error" for the analysis. We publish these results in the Sea Level Trends service of our website. We also publish the range of that statistical error for every station we analyze for.
If you would like to understand more:
This article, Understanding Sea Level Change, authored by our Director in 2008, provides some general information about Sea Level Rise.
Technical Report NOS CO-OPS 53, Sea Level Variations of the United State goes into more detail on the mathematical analysis conducted using the Monthly Mean Sea Level values. You will find that the reports begins detailing the mathematical calculations beginning on page 15 of the report.
I hope that this response has answered your questions.
If not, please let me know.
Should you have additional questions, please contact our office.
E-mail: Tide.Predictions@noaa.gov
Regards,
Center for Operational Oceanographic Products and Services
____________________________________
Then there was this:
Laboratory for Satellite Altimetry
National Oceanic and Atmospheric Administration
NOAA Center for Weather and Climate Prediction (NCWCP)
Thanks for the question about how we estimate errors in the estimates of global mean sea level with satellite altimeters.
As you may know, we usually use "precision" to refer to the random error distribution associated with a particular experiment and "accuracy" is related to the existence of systematic errors. By definition, “precision” of an experiment tells us how much measured values vary from the actual value as we take repeated measurements. In statistics, we refer to the standard error of the mean, sigma_M, which the standard deviation of the mean value of our experiment. It is defined in terms of the precision, which can be estimated from the standard deviation of the measured values, sigma, and the number of repeated measurements:
So, if the precision of our instrument was sigma=33 mm, and we made N=1000 measurements, the standard error on the mean, would be 1 mm. So, it’s quite common to use an experiment with “centimeter precision” to estimate a mean value with a standard error in millimeters. If the only errors in the experiment are normally distribution, then the more measurements that we make, the smaller the standard error on the mean.
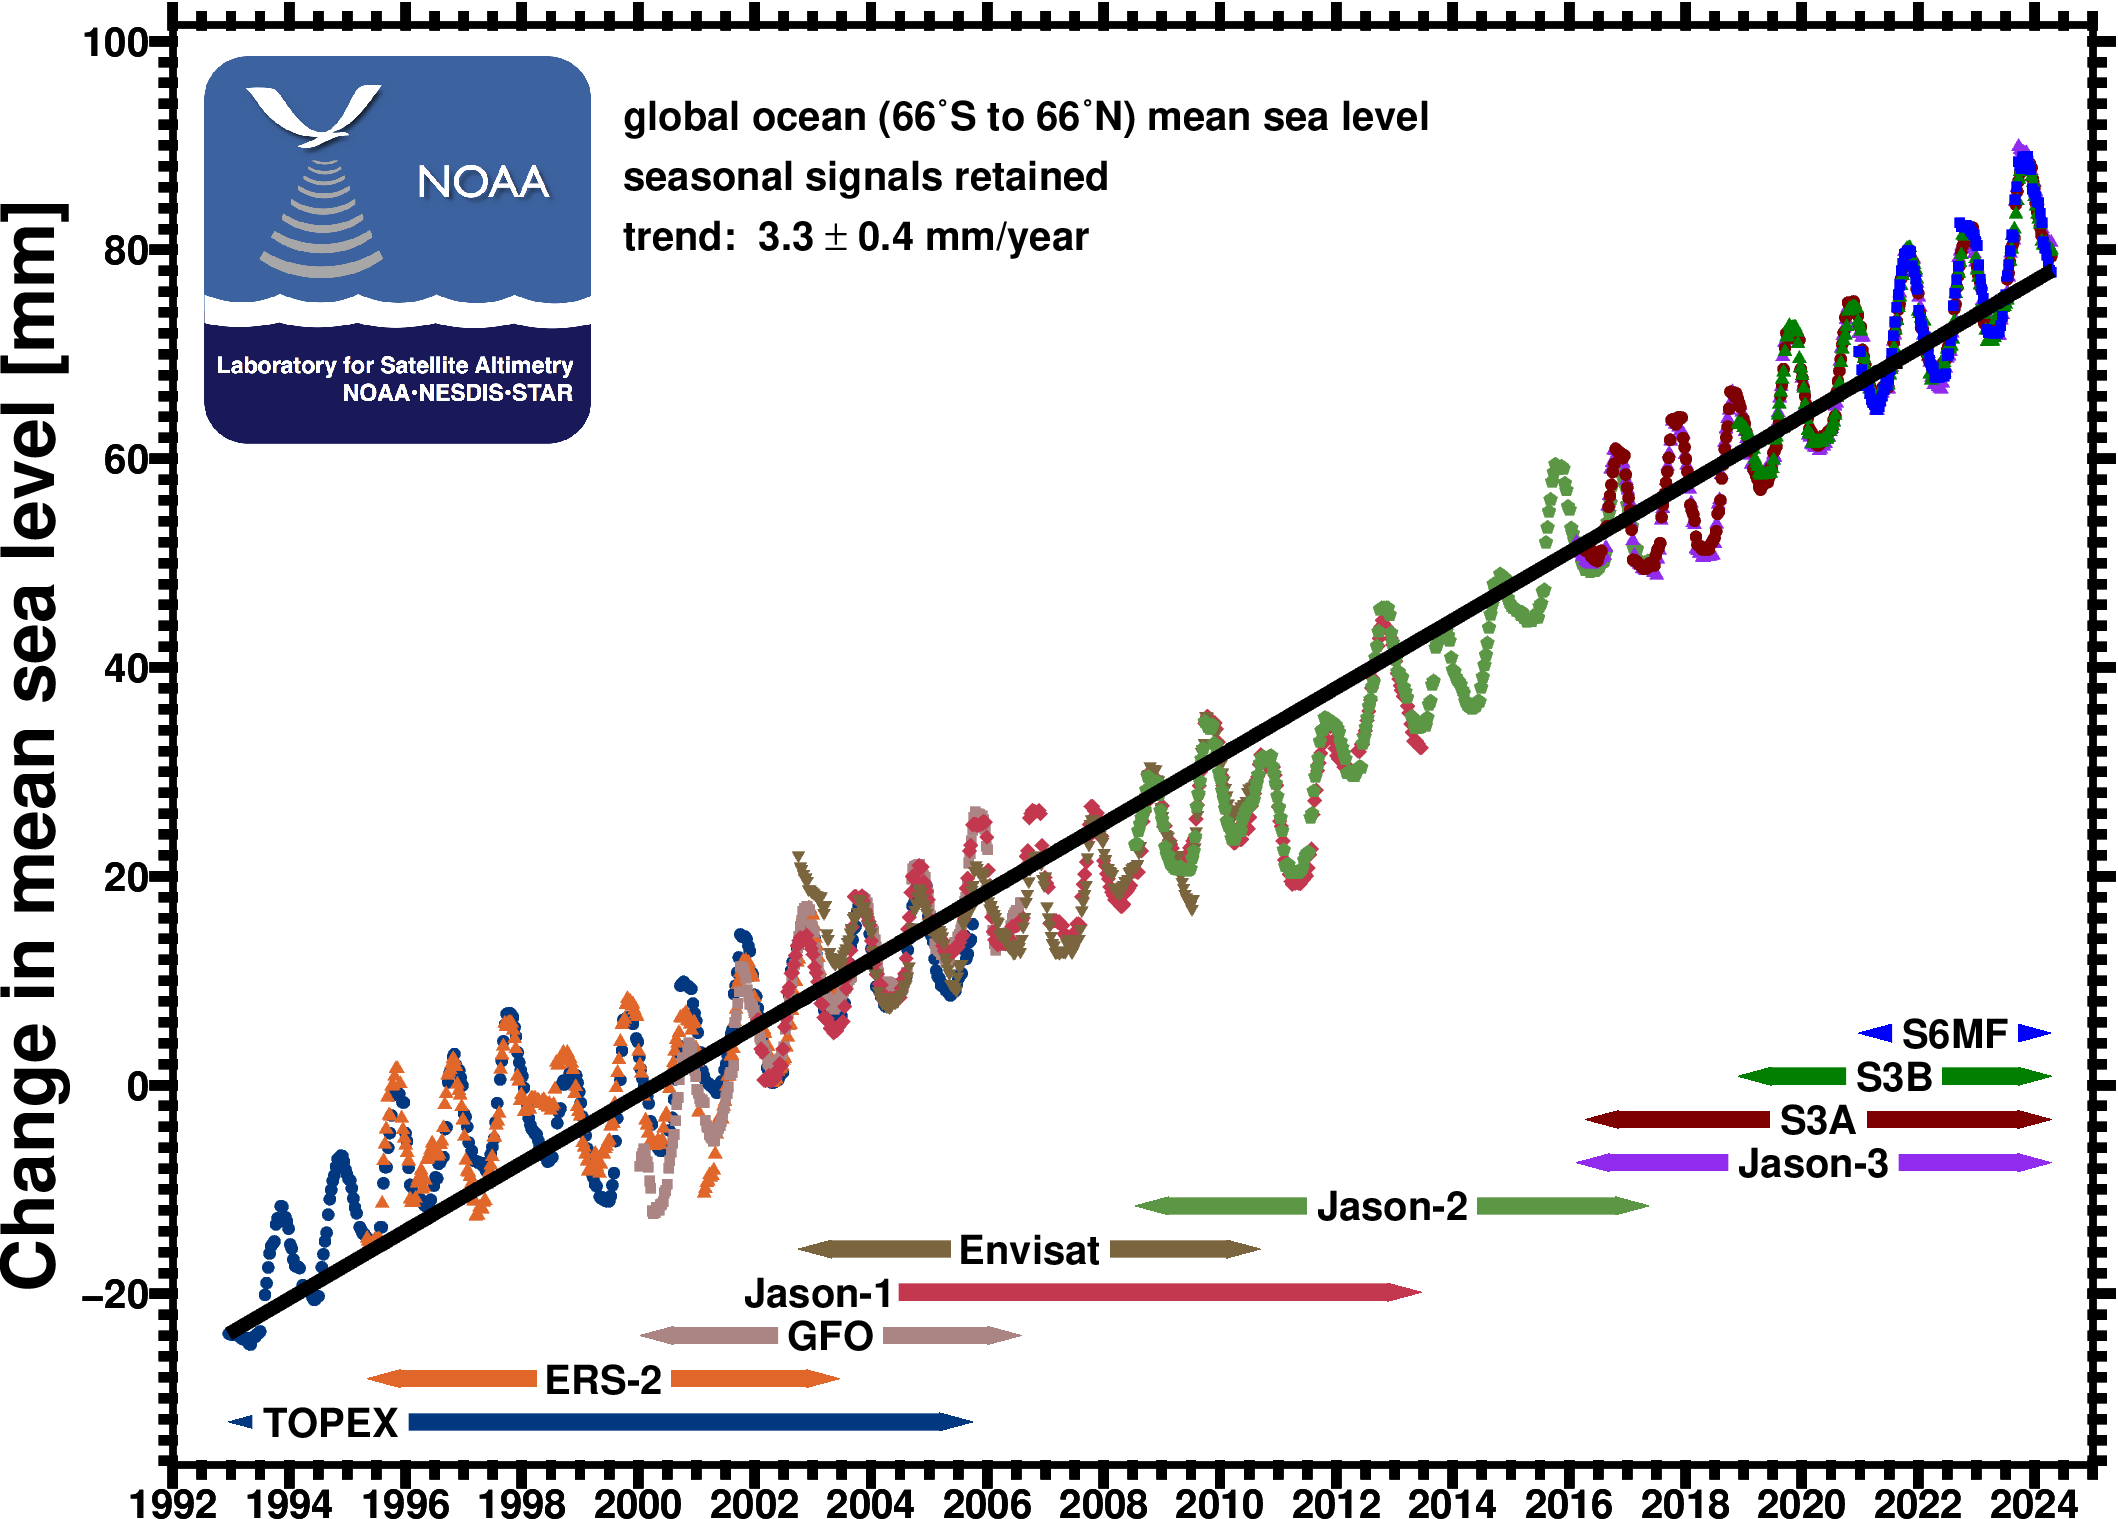
For altimetry, we usually claim that we can estimate global mean sea level every 10 days with a 90% confidence interval of about ±4 mm. The Jason altimeters make about 450000 measurements with about 3.3 cm accuracy every ten days.
Of course, in the case of global mean sea level measurements, we don't have a simple measuring experiment with only random errors. We measure sea level at different points throughout the ocean, so to compute mean sea level with a small error, we have to make sure that we have a representative sample of points. Also, we have to make sure that the systematic errors are small.
We have several examples about why we think that we do indeed have errors of just a few millimeters:
1) We compare mean sea level measurements from a few different altimeters, which measure different patches of the ocean at different times with different instruments, and the results differ by only a few millimeters: http://www.star.nesdis.noaa.gov/sod/lsa/SeaLevelRise/slr/slr_sla_gbl_keep_all_66.png
2) Each ten days we compare sea level measurements from about 64 tide gauges with the nearby points measured by an altimeter (a few hundred of our 450000 points). The standard error of the difference at those just those points is about 4 mm (see http://www.star.nesdis.noaa.gov/sod/lsa/SeaLevelRise/LSA_SLR_tidegauges.php), which implies that the standard error on the global mean from altimetry is smaller than 4 mm.
3) If we measure the thermal expansion of sea level (steric sea level) using the Argo network of floats and add it to the sea level mass change that we measure from a satellite gravity mission called GRACE, we get an independent measurement of total sea level. When we take the 2-month differences between total sea level from Jason and totak sea level from Argo+GRACE, the standard deviation is about 1.6 mm. That also suggests that the error on global mean sea level from Jason every ten days is less than 4 mm.
Yes, it would be okay to use the content of my response in your blog. I appreciate you asking.
____________________________________
I responded with another note and one more question.
How does GRACE data get incorporated with JASON's data for more accuracy?
____________________________________
Laboratory for Satellite Altimetry
National Oceanic and Atmospheric Administration
NOAA Center for Weather and Climate Prediction (NCWCP)
In general, GRACE observations of the mass changes in the ocean and Jason measurements of sea surface height are complementary, but largely independent measurements. All of the altimeter measurements depend on knowing the height of the satellite with respect to the Earth’s center of mass. The precise orbits computed for Jason have a standard error of less than 1 cm.
Most of the time, a model of Earth’s gravity field is used to compute these orbits. In that sense GRACE data have been “incorporated” to improve Jason data, because GRACE (along with other observations) has been used to improve our knowledge of the gravity field.
____________________________________
That's about it.
None of this stuff is magic, complex for sure,
but a good faith effort to learn about it will satisfy.
But, it does require honest curiosity
and the willingness to spend some time doing your homework.
____________________________________
2 comments:
Tamino has a blog post at open mind called "seeing the light" that discusses the power of numerous observations, combined with statistical analysis, to improve precision.
Tamino is a good source for learning all manner of things to do with statistics.
But, I suspect you already knew that.
Cheers.
I knew about the good with explaining statistics, but not that article.
Thanks
Seeing the Light
Post a Comment