(edited March 21, 2017)
... and a question of perspective.
... and a question of perspective.
Alternately, Behold Seepage in Action.
In working on my review of Lamar Smith’s press release I distractedly glanced at Fyfe et al. 2016 a couple times. Then given that John Bates’ singled it out in his ClimateEtc attack piece I took the time to read it carefully. It was written by some of the foremost experts in the field, I’ve listened to their talks on YouTube, I’ve exchanged emails with some. A couple have endured malicious and vicious attacks based on pure fabricated deception, yet they continue doing world class science. These are the real deal, heck some are among my heroes. I don't presume to second-guess such experts about their science.
Yet, I was stunned reading their treatment of the so-called “global warming hiatus” - it’s not their facts I question, but their presentation. Can’t help it, I take climate science communication very seriously and their wording knocked me right off my pins. I've felt compelled to explain my reaction ever since, if only to myself. I've been spending days wrestling with this and I admit I hope some of the authors and a few others will give me a chance to make my case - I've striven to keep my comments as concise as possible. Give it a skim. You decide if I succeed.
NATURE opinion & comment
Making sense of the early-2000s warming slowdown
Nature Climate Change | Vol 6 | March 2016 | Pages 224 to 228
www.nature.com/natureclimatechange © 2016 Macmillan Publishers Limited. All rights reserved
I am reprinting the full text of this paper by right of the Fair Use doctrine -
for the purpose of doing the following detailed critique.
___________________________________________________________________
co-authors
John C. Fyfe, Gerald A. Meehl, Matthew H. England, Michael E. Mann, Benjamin D. Santer, Gregory M. Flato, Ed Hawkins, Nathan P. Gillett, Shang-Ping Xie, Yu Kosaka and Neil C. Swart
____________________________________________________________
The introduction:
It has been claimed that the early-2000s global warming (b) slowdown or hiatus (a)(e), characterized by a reduced rate of global surface warming (c), has been overstated, lacks sound scientific basis, or is unsupported by observations. The evidence presented here contradicts these claims (d).
_______________________________________________________
Why the labyrinthian phrasing? Simplify wording. Clarify meaning.
(a) Creates a false equivalence between “slowdown” and “hiatus” - hiatus means STOPPED! But, Global Warming never stopped!
(b) Creates a false equivalence between “global warming” and “global mean surface warming.”
(c) Furthermore: “early-2000s global warming slowdown or hiatus, characterized by a reduced rate of global surface warming” - implies “surface” warming slowdown (or faux hiatus) is a symptom of a “global” warming slowdown.
(d) “Evidence presented here contradicts these claims.” Given the paragraph's convoluted wording one could easily conclude this is saying: the “hiatus” (that is global warming stopping) is not contradicted
… which is exactly what the contrarian PR machine was hoping they could twist any science into. Why make it so easy?
(e) Why even use the politically charged term “hiatus” beyond a footnote? What possible purpose does it serve other than to fatally wound clarity and invite gross misinterpretation?
This paper seems a textbook example of “seepage” in action. Or as I would phrase it, unconsciously adapting the contrarian’s script. Please keep this in mind as you continue.
_______________________________________________________________________
¶1 A large body of scientific evidence — amassed before and since the Fifth Assessment Report of the Intergovernmental Panel on Climate Change (IPCC AR5)1 — indicates that the so-called surface warming slowdown, also sometimes referred to in the literature as the hiatus,
“sometimes referred to...” ? What purpose is there in reinforcing the faux “hiatus” meme?
_______________________________________________________________________
was due to the combined effects of internal decadal variability and natural forcing (volcanic and solar) superimposed on human-caused warming2.
__________________________________________________________
“internal decadal variabilities” - that would be heat transport?
Why not get explicit and point out that Atmospheric Physics are what's causing Global Warming - not Heat Transport between the oceans and the surface?
_______________________________________________________________________
Given the intense political and public scrutiny that global climate change now receives, it has been imperative for scientists to provide a timely explanation of the warming slowdown, and to place it in the context of ongoing anthropogenic warming. Despite recently voiced concerns, we believe this has largely been accomplished.
__________________________________________________________
“Given the intense political and public scrutiny” makes it sound so nice and benign and constructive.
Why not mention that this intense scrutiny was driven by a malicious PR campaign which ruthlessly misrepresents fundamental climate science facts?
_______________________________________________________________________
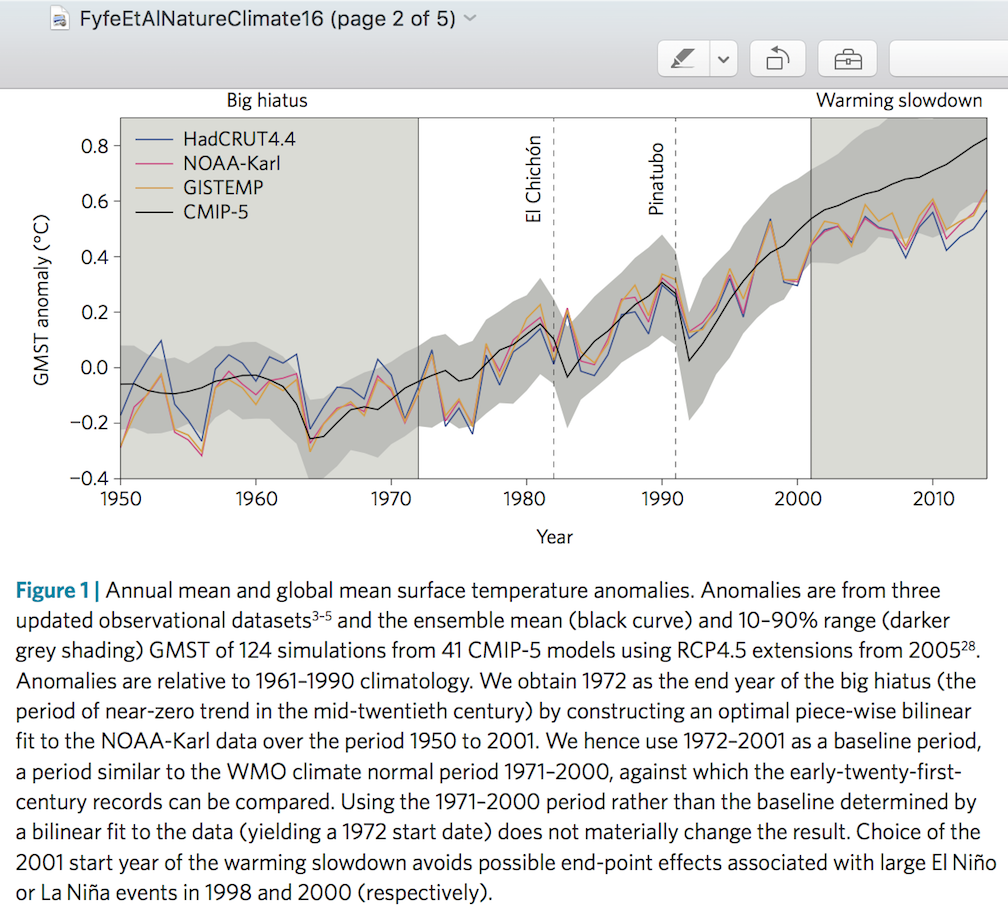
¶2 Figure 1 shows annual average anomalies of global mean surface temperature (GMST) in three updated observational datasets3–5, and averaged over 124 simulations from 41 climate models. The observed rate of global surface warming since the turn of this century has been considerably less than the average simulated rate6. This mismatch helped to initiate discussion of a warming slowdown in observations.
__________________________________________________________
Why no thoughtful discussion about the difference between The Map and The Territory?
We obsess over fractions of numbers who's significances we don't fully understand, don't the past decades of weather trends tell us more than quibbling over fractions?
We obsess over fractions of numbers who's significances we don't fully understand, don't the past decades of weather trends tell us more than quibbling over fractions?
_______________________________________________________________________
We note that in the multi-model mean, averaging across models, damps internal variability, thus providing a less-noisy estimate of the underlying climate response to combined natural (volcanic and solar) and anthropogenic forcing.
__________________________________________________________
This here is bookkeeping, tracking heat transport around the surface of our planet and into the depths of our oceans.
Why not bring it back to the First Order Reality? All this is happening under the atmospheric “dome of insulation.” Nothing slowed down up there.
Why not bring it back to the First Order Reality? All this is happening under the atmospheric “dome of insulation.” Nothing slowed down up there.
_______________________________________________________________________
¶3 Serious scientific interest in the slowdown began around 2009 (for example, ref. 7) when decadal GMST variability was found to be a relatively common feature in twentieth-century observations and climate model simulations.
__________________________________________________________
Again, why leave out that this “serious scientific interest” was driven by an aggressive and deceptive Republican media campaign dedicated to screaming Global Warming Stopped, and that climate scientists were not to be trusted, and that no action was needed?
Scientists bent over backwards to demonstrate their objectivity and quantify every detail.
Did it change any minds? Get real, you are dealing with absolute predators and thugs towards serious thoughtful scientists. Bending over backwards for them simply makes it that much easier to slice your throat.
______________________________________________________________________
Initial attention was focused on the role of internal variability; this work built on an extensive body of research into the nature and causes of internal decadal climate variability — research that had been actively pursued since the 1990s. Subsequent slowdown studies examined contributions from external forcing and observational uncertainty, as we discuss below. This important historical perspective is missing in recent critiques of research into the slowdown (for example, refs 4 and 9).
¶4 How unusual a period of reduced warming is, depends strongly on its length10. Rates of warming remained slow into the early 2010s, but warming in 2014 and the record warmth of 2015 illustrate the sensitivity of warming estimates to choice of trend length, starting point and end point. To illustrate such issues, and to place the slowdown in the context of longer-term trends and variability, we compute overlapping trends using 15-year, 30-year and 50-year windows starting in 1900. Using overlapping windows to characterize the slowdown is preferable to the practice of defining the slowdown based on arbitrary start and end dates (for example, refs 4, 8 and 9). Figure 2a–d compares observed overlapping trends against a measure of model uncertainty in simulated overlapping 15-year trends. In all three observational datasets the most recent 15-year trend (ending in 2014) is lower than both the latest 30-year and 50-year trends. This divergence occurs at a time of rapid increase in greenhouse gases (GHGs)1. A warming slowdown is thus clear in observations; it is also clear that it has been a ‘slowdown’, not a ‘stop’.
____________________________________
Then why the confusing introductory paragraph?
“warming slowdown” - Which warming slow down? Global? Surface? Ocean? What’s the difference?
The point being powerful politicians such as Lamar Smith manipulate such fractional adjustments to scream fraud. - Why not strive to inject perspective?
______________________________________________________________
The slowdown was more pronounced in earlier observational datasets, and in studies based on them. Note also that the most recent observed 15-year trend is lower than the majority of simulated trends; common peaks in the modelled and observed overlapping trends centered around 2000 reflect similar recovery from the Pinatubo eruption in 1991.
____________________________________
Stamp collecting. But, what's it tell us?
______________________________________________________________
Scientific Advances
¶5 The initial focus of post-AR5 slowdown research was to explain why observed and modelled temperature changes differ in the early twenty-first century6. One of the many valuable ancillary benefits of this scientific activity has been an improved understanding of the role of ocean decadal variability in modulating human-caused global surface warming. For example, new research has shown that decadal timescale cooling of tropical Pacific c sea surface temperature (SST) — which is linked to trade-wind intensification associated with the negative phase of the Interdecadal Pacific Oscillation (IPO) — made a substantial contribution to the warming slowdown11–14 (Fig. 2e). Since averaging over a large number of climate model simulations reduces the random noise of internal variability, and assuming a large contribution from internal variability in the slowdown, the mean of the multi-model ensemble (MME) could not be expected to reproduce the slowdown.
¶6 A different perspective on the role of internal variability is obtained through the analysis of the individual models and realizations comprising the MME. In 10 out of 262 ensemble members, the simulations and observations had the same negative phase of the IPO during the slowdown period — that is, there was a fortuitous ‘lining up’ of internal decadal variability in the observed climate system and the 10 simulations15,16. These 10 ensemble members captured the muted early-twenty- first-century warming, thus illustrating the role of internal variability in the slowdown.
____________________________________
“thus illustrating the role of internal variability in the slowdown.”
Why not get graphic: “surface heat gets transported into the oceans”?
______________________________________________________________
¶7 Related work has identified additional contributions to the slowdown from decadal variability arising in the Indian17 and Atlantic Oceans18. However, the flow of heat in these and other ocean basins (including the tropical Pacific) remains poorly constrained by measurements.
____________________________________
An example of unquantifiable variability?
Moral of the story - these details must be put into perspective.
How does it change our understanding of the trajectory of Earth’s weather engine?
______________________________________________________________
Other positive outcomes of this slowdown research include better understanding of the influence of uncertainty in ocean SSTs on decadal timescale GMST trends4, and of the role of decadal changes in volcanic forcing in partially off setting human-caused warming19. Research has also identified a systematic mismatch during the slowdown between observed volcanic forcing and that used in climate models19.
¶8 It has been suggested20 that the lack of Arctic surface measurements has resulted in an underestimate of the true rate of GMST increase in the early twenty-first century. Independent satellite-based observations21,22 of the temperature of the lower troposphere (TLT; Fig. 2f) have near-global, time- invariant coverage. Although satellite TLT datasets also have important uncertainties21, they corroborate the slowdown of GMST increase23 and provide independent evidence that the slowdown is a real phenomenon.
____________________________________
“A real phenomenon” Of what? Measurements?
If the phenomenon is Heat Transport, make it more explicit.
Map vs Territory stuff.
______________________________________________________________
¶9 These examples have built upon earlier advances in our scientific understanding of the causes of fluctuations in GMST. For example, the cooling after the Pinatubo eruption in 1991 was predicted before it could be observed. The ability of climate models to simulate this cooling signal was reported in published papers and IPCC assessments. Previous work noted the importance of the ‘spring-back’ from Pinatubo, which contributed to relatively rapid rates of global warming over the decade of the 1990s (for example, ref. 23); a similar spring-back occurred in the 1980s a er El Chichón.
¶10 Understanding of the recent slowdown also built upon prior research into the causes of the so-called big hiatus from the 1950s to the 1970s. During this period, increased cooling from anthropogenic sulfate aerosols roughly offset the warming from increasing GHGs (which were markedly lower than today). This offsetting contributed to an approximately constant GMST. Ice-core sulfate data from Greenland support this interpretation of GMST behaviour in the 1950s to 1970s, and provide compelling evidence of large temporal increases in atmospheric loadings of anthropogenic sulfate aerosols. The IPO was another contributory factor to the big hiatus13.
____________________________________
Clarify the process so people can understand what you are talking about.
Sulfate aerosols reflected the sun’s energy back into space
before it had the opportunity to be converted into the infrared energy that fuels our climate system. Thus a cooling trend in the GMST and the global system.
______________________________________________________________
¶11 Research motivated by the warming slowdown ____________________________________
If you're going to bring it up yet again, give the complete story.
Describe the excessive attention forced on the Global Warming faux “hiatus.” Attention that was deliberately fabricated, driven by a media PR campaign that's dedicated to denying AGW altogether and stopping all proactive confrontation of this existential crisis we're creating for ourselves.
Describe the excessive attention forced on the Global Warming faux “hiatus.” Attention that was deliberately fabricated, driven by a media PR campaign that's dedicated to denying AGW altogether and stopping all proactive confrontation of this existential crisis we're creating for ourselves.
While scientists have been chasing Koch's bone and exploring minutia - the GOP political machine was in full AGW denial mode with terrifying success, as the recent US political catastrophe revealed.
______________________________________________________________
has also led to a fuller understanding of ocean heat uptake17,24 in the context of decadal timescale variability in GMST. Improved understanding was only possible a er recent progress in identifying and accounting for errors in observed estimates of ocean heat content (OHC)25, and by advances in isolating the signatures of different modes of variability in OHC changes. In summary, research into the causes of the slowdown has been enabled by a large body of prior research, and represents an important and continuing scientific effort to quantify the climate signals associated with internal decadal variability, natural external forcing and anthropogenic factors.
____________________________________
Clarify the process …
The heat was moved to the oceans where 90% of our climate system’s heat resides, thus it was absorbed into the global climate system - even if not registering in the GMST estimate.
Help people viscerally visualize the dynamics.
______________________________________________________________
Claims and Counterclaims
¶13 Recent claims by Lewandowsky et al. that scientists “turned a routine fluctuation into a problem for science” and that “there is no evidence that identifies the recent period as unique or particularly unusual”26 were made in the context of an examination of whether warming has ceased, stopped or paused. We do not believe that warming has ceased, but we consider the slowdown to be a recent and visible example of a basic science question that has been studied for at least twenty years: what are the signatures of (and the interactions between) internal decadal variability and the responses to external forcings, such as increasing GHGs or aerosols from volcanic eruptions?
____________________________________
What’s “unique” about it? Greater understanding of the variety of natural processes and improvements in measuring them? That it? How does that make it unique?
What’s your point in picking this bone with Lewandowsky?
Worst the paper doesn’t acknowledge, the massive disinformation campaign surrounding the recent faux hiatus and how the faux hiatus has been artificially hyper-inflated with a significance it does not warrant.
______________________________________________________________
14 The last notable decadal slowdown during the modern era occurred during the big hiatus. The recent decadal slowdown, on the other hand, is unique in having occurred during a time of strongly increasing anthropogenic radiative forcing of the climate system. This raises interesting science questions: are we living in a world less sensitive to GHG forcing than previously thought27,
____________________________________
What’s “unique” or unusual? Slight down turn, followed by a significant up turn, as we’ve witnessed these past few years?
______________________________________________________________
or are negative forcings playing a larger role than expected?
____________________________________
“forcing”? Why not “Heat transport”? More descriptive.
______________________________________________________________
Or is the recent slowdown a natural decadal modulation of the long-term GMST trend? If the latter is the case, we might expect a ‘surge’ back to the forced trend when internal variability flips phase13.
____________________________________
Isn't that exactly what's being noticed in these past few record breaking years?
______________________________________________________________
¶15 A point of agreement we have with Lewandowsky et al.26 concerns the unfortunate way in which the recent changes have been framed in terms of GMST having “‘stalled’, ‘stopped’, ‘paused’, or entered a ‘hiatus’”. Just exactly how such changes should be referred to is open to debate. Possible choices include ‘reduced rate of warming’, ‘decadal fluctuation’ or ‘temporary slowdown’ — all try to convey the primary mechanism involved, which in the recent example is likely to be internal decadal variability.
____________________________________
Why not demand your opponents truthfully reflect what scientists are explaining?
Stop using the GOP's dishonest script to explain your science. Create a better narrative to convey how our global heat and moisture distribution engine operates.
In full awareness that you are dealing with a hostile Republican audience that is mentally and spiritually profoundly disconnected from Earth Processes.
Strive to crack that echo-chamber they've fabricated around themselves. Tough challenge, perhaps impossible, but anything less is pointless at this juncture in our sorry history.
______________________________________________________________
¶16 The warming slowdown as a statistically robust phenomenon has also been questioned. Recent studies have assessed whether or not trends during the slowdown are statistically different from trends over some earlier period. These investigations have led to statements such as “further evidence against the notion of a recent warming hiatus”4 or “claims of a hiatus in global warming lack sound scientific basis”9. While these analyses are statistically sound, they benchmark the recent slowdown against a baseline period that includes times with a lower rate of increase in greenhouse forcing1, as we discuss below. Our goal here is to move beyond purely statistical aspects of the slowdown, and to focus instead on improving process understanding and assessing whether the observed trends are consistent with our expectations based on climate models.
____________________________________
Sounds like stamp collecting.
When will the informing and clarifying begin?
______________________________________________________________
Baseline Periods
¶17 The claim that the slowdown is not manifest in observations4 is based on comparing recent trends in updated GMSTs against the GMST trend over a baseline period from 1950 to 1999. Given the variability evident in Fig. 1, it is obvious that the choice of start and end dates will determine the extent to which trends over one interval are larger or smaller than those over another interval (as shown in ref. 7). A baseline period that includes the big hiatus, during which time positive anthropogenic GHG forcing was weaker than today (and negative forcing from anthropogenic sulfate aerosol emissions was increasing rapidly), will necessarily yield a relatively small baseline GMST trend. Similarly, comparisons can be strongly affected by computing decadal-scale trends over intervals with end dates influenced by large El Niño or La Niña events, or changes in volcanic aerosols. In our opinion, start and end dates should be selected based on physical understanding of the forcings and processes involved.
¶18 Our exploration of an alternative baseline period is motivated by ΔF, the estimate of anthropogenic radiative forcing28. This represents the perturbation to the radiative budget of the planet from the combined effects of human-caused increases in GHGs and aerosols. Since the Industrial Revolution, human activities have caused net positive forcing of the climate system, leading to overall warming of the surface. Superimposed on this forced anthropogenic response are small signals of solar irradiance changes, cooling and recovery from volcanic eruptions and internal variability.
____________________________________
Surface - why no mention of the ocean and the dynamic transport and intermixing of heat flux?
"Superimposed on this forced anthropogenic response are small signals of solar irradiance changes, cooling and recovery from volcanic eruptions and internal variability.”
A standout sentence in my opinion. Build on to it. Internal variability, that is various vectors of heat transport. Come up with an illustrative paragraph that conveys the notion of our physical dynamic global heat distribution mechanism, rather than showing up with a list.
https://www.youtube.com/watch?v=kpFryXQbVEA&t=31s
______________________________________________________________
¶19 The role of these factors is illustrated in Fig. 3, which shows R(ΔT/ΔF), the anomalies in the ratio of trends in GMST and global- mean anthropogenic radiative forcing. Results are calculated over the big hiatus and warming slowdown periods, as well as over the intervening period. R(ΔT/ΔF) provides information on the change in GMST per unit change in anthropogenic forcing. A simple interpretation is that variations in R(ΔT/ΔF) reflect influences other than anthropogenic forcing, such as external forcing from volcanic eruptions and/or internal variability. Changes in the sign of R(ΔT/ΔF) indicate periods over which non-anthropogenic influences add to or subtract from the anthropogenically forced warming response.
¶20 The big hiatus and slowdown periods show R(ΔT/ΔF) values that are noticeably lower than average, whereas R(ΔT/ΔF) is slightly above average during the intervening period (1972 to 2001). Use of current estimates of total (anthropogenic plus natural) external forcing for calculating R(ΔT/ΔF) yields qualitatively similar results. Although there are remaining uncertainties in both ΔT and ΔF, these are unlikely to explain the pronounced differences in the sign and size of R(ΔT/ΔF) between the 1972 to 2001 baseline and the recent slowdown period from 2001 to 2014. The most plausible interpretation of these differences is that the combined effects of internal variability and natural forcing enhanced warming over the period 1972 to 2001 and reduced warming in the early twenty- first century. A different but complementary approach to ours reached the same conclusion29.
¶21 The big hiatus and warming slowdown periods correspond to times during which the dominant mode of decadal variability in the Pacific—the IPO—was in its negative phase. In the intervening period the IPO was in its positive phase. Recent modelling11–13,15,16,24 and observationally based studies14,18 indicate an important role for Pacific decadal variability in modulating temporal changes in GMST. Based on both of these factors — the relatively steady increase in net anthropogenic forcing over the period 1972 to 2001, and the consistent sign of the IPO during this time — we argue that as a baseline for evaluating whether the surface warming rate is unchanged in the early twenty- first century, 1972–2001 is a preferable choice to 1950–1999. Using this more physically interpretable 1972–2001 baseline, we find that the surface warming from 2001to 2014 is significantly smaller than the baseline warming rate.
____________________________________
No helpful narrative, instead you repeat and reinforced the “hiatus” dog-whistle 13 times and never draw a clean qualitative distinction between the “big hiatus” (reflection of sun’s rays) and the “faux hiatus” (heat moving away from the surface).
Besides, even more important - Why not point out that no one knows precisely how these numbers relate to future impacts anyways, so why are leaders and the public sweating such trivial deviations?
Bring the discuss back to the important issues, the well understood fundamentals dynamics that are in motion.
______________________________________________________________
Concluding Remarks
¶22 Our results support previous findings of a reduced rate of surface warming over the 2001–2014 period — a period in which anthropogenic forcing increased at a relatively constant rate. Recent research that has identified and corrected the errors and inhomogeneities in the surface air temperature record4 is of high scientific value. Investigations have also identified non-climatic artefacts in tropospheric temperatures inferred from radiosondes30 and satellites31, and important errors in ocean heat uptake estimates25. Newly identified observational errors do not, however, negate the existence of a real reduction in the surface warming rate
____________________________________
GMST represents <10% of our climate systems total heat.
What about the many ways oceans and ocean temperatures drive surface weather?
This ‘missing heat’ or ‘sequestered’ heat remains very much a part of the weather engine and our future, even if it doesn’t register on our Surface Temperature Thermometer.
______________________________________________________________
in the early twenty-first century relative to the 1970s–1990s. is reduction arises through the combined effects of internal decadal variability11–18, volcanic19,23 and solar activity, and decadal changes in anthropogenic aerosol forcing32. The warming slowdown has motivated substantial research into decadal climate variability and uncertainties in key external forcings.
_____________________________________________
Again, why not put these internal variations into context?
Why not more discussion about our understanding that our atmosphere’s retention of heat went on unabated?
______________________________________________________________
As a result, the scientific community is now better able to explain temperature variations such as those experienced during the early twenty-first century33, and perhaps even to make skillful predictions of such fluctuations in the future. For example, climate model predictions initialized with recent observations indicate a transition to a positive phase of the IPO with increased rates of global surface temperature warming (ref. 34, and G. A. Meehl, A. Hu and H. Teng, manuscript in preparation).
_____________________________________________
I wish you could explain it to more than computers.
______________________________________________________________
¶23 In summary, climate models did not (on average) reproduce the observed temperature trend over the early twenty-first century6, in spite of the continued increase in anthropogenic forcing. This mismatch focused attention on a compelling science problem — a problem deserving of scientific scrutiny.
_____________________________________________
Actually the challenge, is to do more than collect fascinating stamps.
You aren't astronomers, or archeologists, you are studying the most existentially important question of our time! Don’t treat it as just another “interesting problem.”
How about directly addressing your knowingly hostile audience? Or better yet, find a way to call them on it. Tell it like you know it.
Help explain and clarify how our global heat and moisture distribution engine actually operates - thus confront the deliberate misrepresentation and lies being pumped out by the massive coordinated climate science denial effort - rather than continuing to use their script and handing them such easily manipulated words.
Help explain and clarify how our global heat and moisture distribution engine actually operates - thus confront the deliberate misrepresentation and lies being pumped out by the massive coordinated climate science denial effort - rather than continuing to use their script and handing them such easily manipulated words.
______________________________________________________________
Based on our analysis, which relies on physical understanding of the key processes and forcings involved, we find that the rate of warming over the early twenty-first century is slower than that of the previous few decades. This slowdown is evident in time series of GMST and in the global mean temperature of the lower troposphere. The magnitude and statistical significance of observed trends (and the magnitude and significance of their differences relative to model expectations) depends on the start and end dates of the intervals considered23.
_____________________________________________
'magnitude and statistical significance depends on start, end dates and intervals use'
'magnitude and statistical significance depends on start, end dates and intervals use'
All in all, sounds pretty trivial when it comes to the overall understanding of what's happening.
All in all sounds more like Lewandowsky was correct - and has some thoughts we should all be paying more attention to.
All in all sounds more like Lewandowsky was correct - and has some thoughts we should all be paying more attention to.
After all, never forget your "interesting scientific problem” has been fashioned into a destructive bludgeon for politicians to batter climate scientists with and to ignore their duty to take the science seriously.
______________________________________________________________
¶24 Research into the nature and causes of the slowdown has triggered improved understanding of observational biases, radiative forcing and internal variability. This has led to widespread recognition that modulation by internal variability is large enough to produce a significantly reduced rate of surface temperature increase for a decade or even more — particularly if internal variability is augmented by the externally driven cooling caused by a succession of volcanic eruptions. The legacy of this new understanding will certainly outlive the recent warming slowdown. This is particularly true in the embryonic field of decadal climate prediction, where the challenge is to simulate how the combined effects of external forcing and internal variability produce the time-evolving regional climate we will experience over the next ten years35.
_____________________________________________
I believe this paper should have said twice as much using half the words.
In closing a little self-justification is called for.
I’ll admit, I’m just a nobody out in the middle of nowhere watching the world heedlessly marching itself into self destruction. Tragically our leaders and heroes have spent decades consistently disappointing with a parade of stupid mistakes who’s disastrous (if profitable for some) outcomes were all too predictable. With this latest self-inflicted US election monstrosity my bubble of inferiority has popped and I will speak out as rationally and constructively as I can muster. Then when reading this report, Fyfe et al 2016 closely, it was like getting mugged, or as Stephen would have said, ‘it knocked me off my pins’ and it demanded I attempt enunciating why it read like such a betrayal.
Keep in mind the malicious misrepresentation of climate science is based on deliberate rhetorical games, designer misinformation, gross omissions, lies, hostile emotionalizing and demonizing with ruthless freewheeling slander and libel. Those things I have been intently studying while climate scientists have been intently doing serious science, this is why I feel empowered to write and share this. There needs to be at least one Earth-centric voice out there and if nothing else at least I now have some closure on this latest assault.
Respectfully yours,
Peter Miesler
aka citizenschallenge
(…@gmail.com)
______________________________________________________________
References
1. Flato, G. et al. in Climate Change 2013: e Physical Science Basis (eds Stocker, T. F. et al.) Ch. 9 (IPCC, Cambridge Univ. Press, 2013).
2. Trenberth, K. E. Science 349, 691–692 (2015).
3. Morice, C. P., Kennedy, J. J., Rayner, N. A. & Jones, P. D.
J. Geophys. Res. 117, D08101 (2012).
4. Karl, T. R. et al. Science 348, 1469–1472 (2015).
5. Hansen, J., Ruedy, R., Sato, M. & Lo, K. Rev. Geophys.
48, RG4004 (2010).
6. Fyfe, J. C., Gillett, N. P. & Zwiers, F. W. Nature Clim. Change
3, 767–769 (2013).
7. Easterling, D. R. & Wehner, M. F. Geophys. Res. Lett.
36, L08706 (2009).
8. Lewandowsky, S., Risbey, J. S. & Oreskes, N. Sci. Rep.
5, 16784 (2015).
9. Rajaratnam, B., Romano, J., Tsiang, M. & Di enbaugh, N. S.
Climatic Change 133, 129–140 (2015).
10. Santer, B. D. et al. J. Geophys. Res. 116, D22105 (2011).
11. Meehl, G. A. et al. J. Climate 26, 7298–7310 (2013).
12. Kosaka, Y. & Xie, S.-P. Nature 501, 403–407 (2013).
13. England, M. H. et al. Nature Clim. Change 4, 222–227 (2014). 14. Steinman, B. A., Mann, M. E. & Miller, S. K. Science
347, 988–991 (2015).
15. Risbey, J. et al. Nature Clim. Change 4, 835–840 (2014).
16. Meehl, G. A., Teng, H. & Arblaster, J. M. Nature Clim. Change
4, 898–902 (2014).
17. Nieves, V., Willis, J. K. & Patzert, W. C. Science 349, 532–535 (2015). 18. Dai, A., Fyfe, J. C., Xie, S.-P. & Dai, X. Nature Clim. Change
5, 555–559 (2015).
19. Solomon, S. et al. Science 333, 866–870 (2011).
20. Cowtan, K. & Way, R. G. Quart. J. Roy. Meteorol. Soc.
140, 1935–1944 (2014).
21. Mears, C. A., Wentz, F. J., orne, P. & Bernie, D. J. Geophys. Res.
116, D08112 (2011).
22. Christy, J. R., Norris, W. B., Spencer, R. W. & Hnilo, J. J. J. Geophys. Res. 112, D06102 (2007).
23. Santer, B. D. et al. Nature Geosci. 7, 185–189 (2014).
24. Meehl, G. A. et al. Nature Clim. Change 1, 360–364 (2011). 25. Domingues, C. M. et al. Nature 453, 1090–1093 (2008). 26. Lewandowsky, S., Risbey, J. & Oreskes, N.
Bull. Amer. Meteorol. Soc. http://dx.doi.org/10.1175/
BAMS-D-14-00106.1 (2015).
27. Marotzke, J. & Forster, P. M. Nature 517, 565–570 (2015).
28. Meinshausen, M. et al. Climatic Change 109, 213–241 (2011). 29. Huber, M. & Knutti, R. Nature Geosci. 7, 651–656 (2014).
30. Sherwood, S. C. & Nishant, N. Environ. Res. Lett.
10, 054007 (2015).
31. Po-Chedley, S., orsen, T. J. & Fu, Q. J. Climate
28, 2274–2290 (2015).
32. Schmidt, G. A., Shindell, D. T. & Tsigaridis, K. Nature Geosci.
7, 158–160 (2014).
33. Hawkins, E., Edwards, T. & McNeall, D. Nature Clim. Change
4, 154–156 (2014).
34. oma, M., Greatbatch, R. J., Kadow, C. & Gerdes, R.
Geophys. Res. Lett. 42, 6454–6461 (2015).
35. Meehl, G. A. et al. Bull. Amer. Meteorol. Soc. 95, 243–267 (2014).
Acknowledgements
We thank Thomas Karl, Susan Solomon, Jochem Marotzke, Stefan Rahmstorf, Steve Lewandowsky, James Risbey and Naomi Oreskes for their comments on earlier drafts. We acknowledge the Program for Climate Model Diagnosis and Intercomparison and the World Climate Research Programme’s Working Group on Coupled Modeling for their roles in making the WCRP CMIP multi-model datasets available.
Portions of this study were supported by the Regional and Global Climate Modeling Program (RGCM) of the US Department of Energy’s Office of Biological & Environmental Research (BER) Cooperative Agreement # DE-FC02-97ER62402, and the National Science Foundation.
Author contributions
J.C.F. and G.A.M. conceived the study. J.C.F. undertook the calculations and wrote the initial draft of the paper. All the authors helped with the analysis and edited the manuscript.
________________________________________________________________________________
How do you relate what you do with what's happening here?
Explaining Extreme Events from a Climate Perspective
This BAMS special report presents assessments of how climate change may have affected the strength and likelihood of individual extreme events.
______________________________________________________________
Appreciating Earth's Climate
Who says understanding Earth’s Evolution is irrelevant?
______________________________________________________________
Recurrent Fury: Conspiratorial Discourse in the Blogosphere Triggered by Research on the Role of Conspiracist Ideation in Climate Denial
Stephan Lewandowsky, John Cook, Klaus Oberauer, Scott Brophy, Elisabeth A. Lloyd, Michael Marriott
Vol 3, No 1 (2015) > Lewandowsky
~~~~~~~~~~~~~~~~~~~~~
Climate denial linked to conspiratorial thinking in new study
Dana Nuccitelli. Wednesday July 8, 2015
~~~~~~~~~~~~~~~~~~~~~
On the definition and identifiability of the alleged “hiatus” in global warming
Stephan Lewandowsky, James S. Risbey & Naomi Oreskes
Scientific Reports 5, Article number: 16784 (2015)
doi:10.1038/srep16784
~~~~~~~~~~~~~~~~~~~~
New study finds ‘no substantive evidence’ of a global warming ‘pause’
By Chris Mooney November 24, 2015
~~~~~~~~~~~~~~~~~~~~
Seepage: The effect of climate denial on the scientific community
Professor, School of Experimental Psychology and Cabot Institute, University of Bristol
Posted on 7 May 2015
~~~~~~~~~~~~~~~~~~~~
NASA Faked the Moon Landing—Therefore, (Climate) Science Is a Hoax
An Anatomy of the Motivated Rejection of Science
First Published March 26, 2013
~~~~~~~~~~~~~~~~~~~~
The global climate 2011-2015:
heat records and high impact weather
November 8, 2016 - World Meteorological Organization
~~~~~~~~~~~~~~~~~~~~
(February 4, 2010) Stephen Schneider, professor of biology at Stanford and senior fellow at the Woods Institute for the Environment, unpacks the political and scientific debates surrounding climate change.
________________________________________________________
How rapidly we forgot.
(February 4, 2010) Stephen Schneider, professor of biology at Stanford and senior fellow at the Woods Institute for the Environment, unpacks the political and scientific debates surrounding climate change.
________________________________________________________
How rapidly we forgot.
5 comments:
I emailed the above to all the co-authors, I'm not sure what I expected, but I was disappointed by what I received from Dr. Frye, "This is offensive. Please stop emailing me." Stop. Well, okay, didn't have any plans to continue, I shared what I needed to share. But I'm hurt that's all he had. My intention wasn't to create offense - this is about wanting to 'provoke' some deeper introspection.
Still, if he wants to play that card - the way Fyfe2016 was written was offensive and rattled me to the core. This was my process to enunciate precisely why. I put my best effort into it and it is what it is.
That is the way arguments are supposed to move forward. Well, in a rational world.
Sorry above that misspelling. It's Dr. Fyfe, no idea why spell check changed what I've typed, I apologize for missing it yesterday evening.
I should have waited a day to respond to Dr. Fyfe's "This is offensive. Please stop emailing me."
because a more thoughtful and meaningful response would have been:
Really?
Is it offensive, or does it hurt your feelings?
Isn't learning all about getting over one's many hurt feeling in pursuit of better honest understanding?
I spelled out my reasoning in a civil rational manner.
I made specific claims about that confusing introductory paragraph.
It was not laced with insults or innuendo.
There was nothing personal about it, except that is your name at the top of this paper.
It was filled with specifics about serious objections to the paper's phrasing.
Why not acknowledge my claims and dispute them?
Aren't we supposed to be engaged in a learning process!
After all, sometimes the master can learn a thing or two from the pauper.
Best Wishes
I received the following from Dr. Mann:
Michael E. Mann
March 3, 2016 ·
My open letter to Congressman Lamar Smith (R-TX):
_________________
Dear Congressman Lamar Smith,
Please don't misrepresent (http://dailysignal.com/2016/02/26/the-inconvenient-facts-the-media-ignores-about-climate-change/) our recent Nature Climate Change commentary (http://www.nature.com/…/journal/v6/n3/full/nclimate2938.html).
Our study does NOT support the notion of a "pause" in global warming, only a *temporary slowdown*, which was due to natural factors, and has now ended.
Our recent work (http://www.nature.com/articles/srep19831), which you fail to cite, indicates that the record warmth we are now experiencing can only be explained by human-caused global warming.
Sorry jeffrin turner at 2:48 AM - this space is reserved for people who want to engage in discussing these items. I am not here to help you advertise your blog.
Good day, CC
Post a Comment