A virtual debate with Jim Steele based on his interview at Heartland Institute:
Research Fellow H. Sterling Burnett (for the National Center for Policy Analysis) interviews Jim Steele, ecologist, director emeritus of the Sierra Nevada field campus of San Francisco State University
______________________________________________
Mr. Jim Steele: "And we trust the scientific theory because it been fairly tested by others - the theory must out perform all alternate explanations, eliminate confounding factors plus lively debate. But, what I was finding was the scientific process was being defiled when scientists refused to debate in public. ... and any attempt to prevent that debate, in our schools, in the media, in peer reviewed science, it's only denigrating the scientific process. ... And I think those public debates would help create real climate literacy …"Well then Mr. Steele, let's have our Great Global Warming Science Debate. I will accept these responses from your Heartland Institute podcast as your opening round. I'll offer my rebuttals, evidence and questions. I agree to post your thoughtful responses unaltered. (Though it is looking like you're going to do your best to hide and ignore these critiques of your self-certain claims. Your silence will serve to expose your hypocrisy and inability to defend your statements on an even playing field.)
In this fourth installment I'll be debating your next shrill cry of fraud over how NOAA and others processes raw temperature data.
______________________________________
______________________________________
______________________________________
Steele: In addition when I analyzed California's local climate trends in relationship to wild life changes, much of the raw data that I saw~ ~ ~ ~ ~
Specifically what data sets did you gather for this "analysis"? Where can we view that? Can you explain your methods for processing the data and arriving at your conclusions?
Worse, the logic you employ totally demands an a priori assumption that scientists must be fraudulently manipulating data, while you ignore all sorts of available information about why certain adjustments are made.
~ ~ ~
Jim, for your edification, here's what a serious attempt to research the PDO and impacts on California looks like:
California Climate: Pacific Ocean Connection
http://essea.strategies.org/module.php?module_id=122
_________________________________
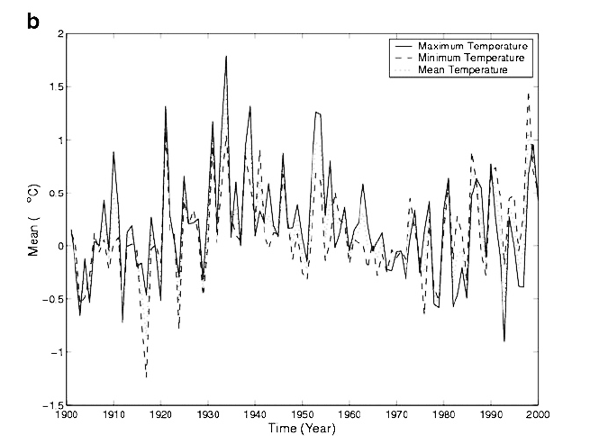
Steele: suggested typical warming and cooling associated with the Pacific Decadal Oscillation and those cyclical patterns were not obvious at first...~ ~ ~ ~ ~
At your blog I found this: "The results seen below (figure b) suggest recent climate change has been more cyclical. Those cyclical changes parallel the Pacific Decadal Oscillation (PDO)."
Please notice there's no PDO indicated on this graph, nor anywhere else in your landscapesandcycles-story, we're supposed to accept your certainty. That's not science Mr. Steele.

~ ~ ~
The point is, PDO and other global circulation currents will certainly continue circulating and impacting weather, but they are now part of an increasingly warmed up energized climate engine and weather patterns will never be anything like pre 1970s ever again.
That's not faith, it's physics!
PS. The moral is that, the runway behind us don't do us any good !
_________________________________
Steele: because climate scientists were actually altering the raw data. And of course some adjustments, if a weather station has moved from a place or another or instrumentation is changed, those interrupted trends have to be adjusted. But NOAA was creating warming trends by a process called homogenization at stations that never had moved and no warming trend had existed before, they were creating one.~ ~ ~ ~ ~
Jim, why do you ignor the Time of Observation Bias (TOB) issue?
Here again, the one thread through this is your absolute conviction that scientists are trying to trick the public. Where did that come from?
Here you are implying that this "homogenization" is some weird whim that someone dreamt up and snuck into the process to trick us.
"Sceptics complain a lot about adjustments made in indexing temperatures. Rarer is an acknowledgement of the argument for the adjustments. The fact is that if an adjustment is appropriate, then it is required. It's not optional.
This post will set out the quantitative basis for one of the larger adjustments to USHCN, a frequent object of this complaint. This is TOBS,..."
_________________________
Steven Mosher
"Christopher Booker win’s the irony of the year award with his piece on adjustments to the temperature record. That’s quite a feat considering it’s only February. His complaint overlooks the clear historical fact that skeptics, above all others, have made the loudest case for the need to adjust the temperature series. Over the years, it’s been skeptics, who have made a vocal case for adjustments . More disturbing is the claim that these adjustments are somehow criminal. We dealt with these type of claims before and completely debunked them. ...
... Given that both skeptics and the mainstream scientists agree that changes in sensors, changes in time of observation and changes in location can bias the record, the question is. What do you do?
- Attempt to adjust the data.
- Only use “good” data.
- Use the raw data only.
Before we even debate that decision, however, we can start by looking at whether the question really matters. Here, for example, is a comparison of BerkeleyEarth with No adjustments, BerkeleyEarth with metadata adjustments only, and BerkeleyEarth will all adjustments:"

Steele: Now the upper ten feet of the ocean contain more heat than the entire atmosphere so pure ventilation of ocean heat has a tremendous effect on regional climates.~ ~ ~ ~ ~
So, what of it? And there's a whole bunch more ocean below that which also has a tremendous effect on regional climates and storm systems.
Check it out:
http://www.argo.ucsd.edu/global_change_analysis.html- - -
Speaking of tremendous effect on regional climates Jim, how do atmospheric events like the "RRR" fit into your theory of no global warming impacts?
The Ridiculously Resilient Ridge Returns; typical winter conditions still nowhere to be found in California
by Daniel Swain on February 16, 2015
http://www.weatherwest.com/archives/2947_________________________________
Steele: So I wasn't sure how much I understood these natural cycles and a recent paper confirmed that almost all of Western North American climate can be explained by this Pacific Decadal Oscillation.~ ~ ~ ~ ~
It takes more than reading a couple studies you like to gain a real understanding of a complex topic.
{I mean can we get serious Jim. Just like you, I do a lot of science reading and thinking, I have developed my knowledge and opinions, but I am also cognizant of my limitations and the potential of blind-spots and I will listen to new information and allow better information to soak in, even if it demands abandoning what I had believed based on partial or erroneous understanding. What happened to you?}
7. Fall, (Actually, Anthony Watts, et al.), (2011) Analysis of the impacts of station exposure on the U.S. Historical Climatology Network temperatures and temperature trends.
Journal Of Geophysical Research, Vol. 116
http://onlinelibrary.wiley.com/doi/10.1029/2010JD015146/abstractThe problem with this paper is that its been demonstrated to make fundamental errors. An indication of it's irrelevance, is that it had all of 20 cites since its 2011 publication. But, don't you know, it's more testimony that the science isn't being censored.
Version 2 Monthly Temperature Homogenization Processing Steps
The data from each HCN station were subject to the following quality control and homogeneity testing and adjustment procedures.
Quality Evaluation and Database Construction
See Table 1 for an overview of the database construction and quality control steps.
Time of Observation Bias Adjustments
After the quality control of the monthly database, monthly temperature values are adjusted for the time-of-observation bias (Karl et al. 1986; Vose et al., 2003).
Homogeneity Testing and Adjustment Procedures
Following the TOB adjustments, the homogeneity of the TOB-adjusted temperature series is assessed. In the USHCN version 1 temperature monthly datasets, homogeneity adjustments were performed using the procedure described in Karl and Williams (1987). This procedure was used to evaluate non-climatic discontinuities (artificial changepoints) in a station's temperature or precipitation series caused by known changes to a station such as equipment relocations and changes. ... (it get's detailed and interesting but too long to post here.)
Estimation of Missing Values
Following the homogenization process, estimates for missing data are calculated using a weighted average of values from highly correlated neighboring values. The weights are determined using a procedure similar to the SHAP routine. This program, called FILNET, uses the results from the TOB and homogenization algorithms to obtain a more accurate estimate of the climatological relationship between stations. The FILNET program also estimates data across intervals in a station record where discontinuities occur in a short time interval, which prevents the reliable estimation of appropriate adjustments.
Urbanization Effects
In the USHCN version 1 dataset, the regression-based approach of Karl et al. (1988) was employed to account for the impact of urban heat islands on USHCN stations trends. In contrast, no specific urban correction is applied in version 2 because the change-point detection algorithm effectively accounts for any "local" trend at any individual station. ...
_________________________________Now specifically about Anthony's study:
So-called blockbuster climate change studies prove little
By Jason Samenow | July 30, 2012 | AP News Registry
~ ~ ~
More evidence attention-grabbing climate studies prematurely rushed and potentially flawed
By Jason Samenow | July 31, 2012 | AP News Registry
New information has since emerged suggestive of potential problems with their work reinforcing the pitfalls in accepting their conclusions and further implicating Muller and Watts in scientifically questionable publicity stunts.
Let’s begin with Watts.
His central claim is that NOAA’s temperature data for the U.S. between 1979 to 2008 shows too much warming due to “spurious adjustments.” Using raw data from the highest quality weather stations, he and his colleagues calculate a warming rate of 0.155 degrees Celsius (C) per decade, 50 percent less than NOAA’s adjusted estimate of 0.309 degrees C per decade for all weather stations (of varying quality).
The blogosphere has quickly pointed out two problems with Watts’ estimates:
1) Independent satellite data - which Watts posts on his blog each month and has stood behind - indicate a warming over the U.S. closer to NOAA’s estimate. This point was raised by ClimateAudit blogger Steven McIntyre: “Over the continental US, the UAH satellite record shows a trend of 0.29 deg C/decade (TLT) from 1979-2008,” McIntyre said.
Interestingly, McIntyre is listed as a co-author of the Watts paper but begins a blog post expressing “puzzlement at Anthony’s [Watts’press release] announcement”and qualifies his involvement as “very last minute and limited”. And he admits to not having “parsed” parts of the Watts study.
2) Watts’ failure to make certain adjustments to the raw data, as NOAA has done, is a serious flaw knowledgeable bloggers say. Specifically, Watts did not apply a time of observation bias correction according to Howard University chemistry professor Josh Halpern, who blogs under the pseudonym Eli Rabett. McIntyre also addressed this problem: “There is a confounding interaction with TOBS [time of observation] that needs to be allowed for, as has been quickly and correctly pointed out.”
(For its part, NOAA defended the legitimacy of its peer-reviewed temperature record telling the New York Times’ Andrew Revkin “if anything, we are under-estimating the real world warming trends for the contiguous United States.” Regarding Watts’ work, it said: “we don’t want to comment on the draft pre-submission paper for obvious reasons.”)
_________________________________
No, Adjusting Temperature Measurements Is Not a Scandal
By Phil Plait
http://www.slate.com/blogs/bad_astronomy/2015/02/10/global_warming_adjusting_temperature_measurements.html
_________________________________
Now a look at what all these adjustments are about:
A short introduction to the time of observation bias and its correction
Due to recent events, the time of observation bias in climatological temperature measurements has become a hot topic. What is it, why is it important, why should we and how can we correct for it? A short introduction.
_________________________________
Watts' New Paper - Analysis and Critique
Posted on 2 August 2012 by dana1981, Kevin C
"An area and distance weighted analysis of the impacts of station exposure on the U.S. Historical Climatology Network temperatures and temperature trends"
Paper authors: A. Watts, E. Jones, S. McIntyre and E. R. Christy
In an unpublished paper, Watts et al. raise new questions about the adjustments applied to the U.S. Historical Climatology Network (USHCN) station data (which also form part of the GHCN global dataset). Ultimately the paper concludes "that reported 1979-2008 U.S. temperature trends are spuriously doubled." However, this conclusion is not supported by the analysis in the paper itself. Here we offer preliminary constructive criticism, noting some issues we have identified with the paper in its current form, which we suggest the authors address prior to submittal to a journal. As it currently stands, the issues we discuss below appear to entirely compromise the conclusions of the paper.
The Underlying Problem
In reaching the conclusion that the adjustments applied to the USHCN data spuriously double the actual trend, the authors rely on the difference between the NCDC homogenised data (adjusted to remove non-climate influences, discussed in detail below) and the raw data as calculated by Watts et al. The conclusion therefore relies on an assumption that the NCDC adjustments are not physically warranted. They do not demonstrate this in the paper. They also do not demonstrate that their own ‘raw’ trends are homogeneous.
Ultimately Watts et al. fail to account for changing time of observations, that instruments change, or that weather stations are sometimes relocated, causing them to wrongly conclude that uncorrected data are much better than data that takes all this into account. ...
Changing Time of Observations
The purpose of the paper is to determine whether artificial heat sources have biased the USHCN data. However, accounting for urban heat sources is not the only adjustment which must be made to the raw temperature data. Accounting for the time of observations (TOB), for example, is a major adjustment which must be made to the raw data (i.e. see Schaal et al. 1977 and Karl et al. 1986). ...
Instruments Change, Stations Move
As Zeke Hausfather has also discussed, the biggest network-wide inhomogeneity in the US record is due to the systematic shift from manually-read liquid-in-glass thermometers placed in a louvred screen (referred to in the U.S. as a Cotton Region Shelter and elsewhere as a Stevenson screen) to automated probes (MMTS) in cylindrical plastic shelters across large parts of the network in the mid- to late-1980s. This widespread equipment change caused an artificial cooling in the record due to differences in the behaviour of the sensors and the sheltering of the instruments. This is discussed in a number of papers, for example Menne et al. 2009 and 2010, and like TOB does not appear to be accounted for by Watts et al.
Additionally, ...
Quite simply, the data are homogenised for a reason. Watts et al. are making the case that the raw data are a ‘ground truth’ against which the homogenisations should be judged. Not only is this unsupported in the literature, the results in this paper do nothing to demonstrate that. It is simply wrong to assume that all the trends in raw data are correct, or that differences between raw and adjusted data are solely due to urban heat influences. However, these wrong assumptions are the basis of the Watts conclusion regarding the 'spurious doubling' of the warming trend.
The Amplification Factor
The conclusion regarding the lower surface temperature warming trend is also at odds with the satellite temperature data. Over the continental USA (CONUS), satellites show a 0.24°C per decade warming trend over the timeframe in question. According to Klotzbach et al. (2010), which the Watts paper references, ...
_________________________________
Telegraph {and Jim Steele} wrong again on temperature adjustments
Posted on 24 February 2015 by Kevin Cowtan
_________________________________
2015 SkS News Bulletin #1: Adjusting Temperature Records
Posted on 24 February 2015 by John Hartz
_________________________________
INDICATORS OF CLIMATE CHANGE IN CALIFORNIA
[08/08/13]
- Download the report Indicators of Climate Change in California
- Download the Summary Report: Indicators of Climate Change in California
- Download the Press Release issued jointly by OEHHA and Cal/EPA
The Office of Environmental Health Hazard Assessment (OEHHA) announces the availability of "Indicators of Climate Change in California," a report presenting 36 indicators tracking trends in atmospheric gases that influence climate, changes in the state's climate, and the impacts of climate change on California's environment and people. This report is an update to a 2009 report.
________________________________________________
Joshua trees are gradually dying out in parts of the national park. The knee-high young trees that once were plentiful have vanished from some areas. Scientists say it’s one of many examples of climate change affecting plants, and rising temperatures are likely to bring more dramatic changes to desert landscapes.
Some lizards and insects have been disappearing from areas where they once thrived, and populations of birds have shifted to higher elevations as the climate has grown hotter and drier. Scientists say rising temperatures and extreme droughts are posing new threats for desert animals.
The Colorado River Basin is in one of the worst 14-year droughts in 1,200 years. Lake Mead’s rapidly sinking water level is set to reach a record low, and scientists say climate change is exacerbating the problems of a water system that is already over-tapped and declining.
________________________________________________
CLIMATE CHANGE IMPACTS ON CALIFORNIA VEGETATION: PHYSIOLOGY,
LIFE HISTORY, AND ECOSYSTEM CHANGE
A White Paper from the California Energy Commission’s California Climate Change Center | July 2012
________________________________________________
Our Changing Climate Assessing the Risks to California
________________________________________________
Top 10 signs of climate change in Northern California
by Alessandra Bergamin on September 05, 2013
________________________________________________
Climate Change – What Should Southern California Prepare for?
________________________________________________
Report: Climate Change Already Having Major Impacts on California
August 12, 2013 | KQED
Climate change poses an "immediate and growing threat" to California's water, vegetation and wildlife according to a report released Thursday by the state's Environmental Protection Agency. The report outlines the current effects, which include increased wildfires, rising sea levels along the California coasts and migration of plants and animals to higher elevations. We discuss the study, and examine state efforts to address the climate challenge.
Host: Penny Nelson
Guests:
Christopher Field, founding director of the Carnegie Institution's Department of Global Ecology, professor of biology and environmental Earth system science at Stanford University and co-chair of Working Group II of the Intergovernmental Panel on Climate Change
Craig Miller, science editor for KQED
Matt Rodriquez, California secretary for environmental protection
More info:
Indicators of Climate Change in California : California's Office of Environmental Health Hazard Assessment
________________________________________________
No comments:
Post a Comment